Skip to content

Style limits qq#182

Merged
daniel-caichac-DHI merged 4 commits intomainfrom
style_limits_QQ
Apr 19, 2023
Merged

Style limits qq#182
daniel-caichac-DHI merged 4 commits intomainfrom
style_limits_QQ

Conversation

@daniel-caichac-DHI
Copy link
Copy Markdown
Collaborator

@daniel-caichac-DHI daniel-caichac-DHI commented Apr 11, 2023

Hi, two small changes

  • First, I added one more bin on the Scatter plot on both edges, because before it was difficult to see the first/last quantiles plot. Actually since Xlim was = to max (x), the final point was cut in half. See fig. before/after.

Before

image

Now

image

  • Second and last, the way the scatter density was being calculated was missing half a bin at both edges, which eliminated the extreme points (they were present in the QQ but not in the scatter). This only happened when show_density=True. If false, all points where there.

See before:

show_density=True
image
show_density=False
image

Now it shows all the points on the extremes.

See now

image

Copy link
Copy Markdown
Member

@ecomodeller ecomodeller left a comment

Choose a reason for hiding this comment

The reason will be displayed to describe this comment to others. Learn more.

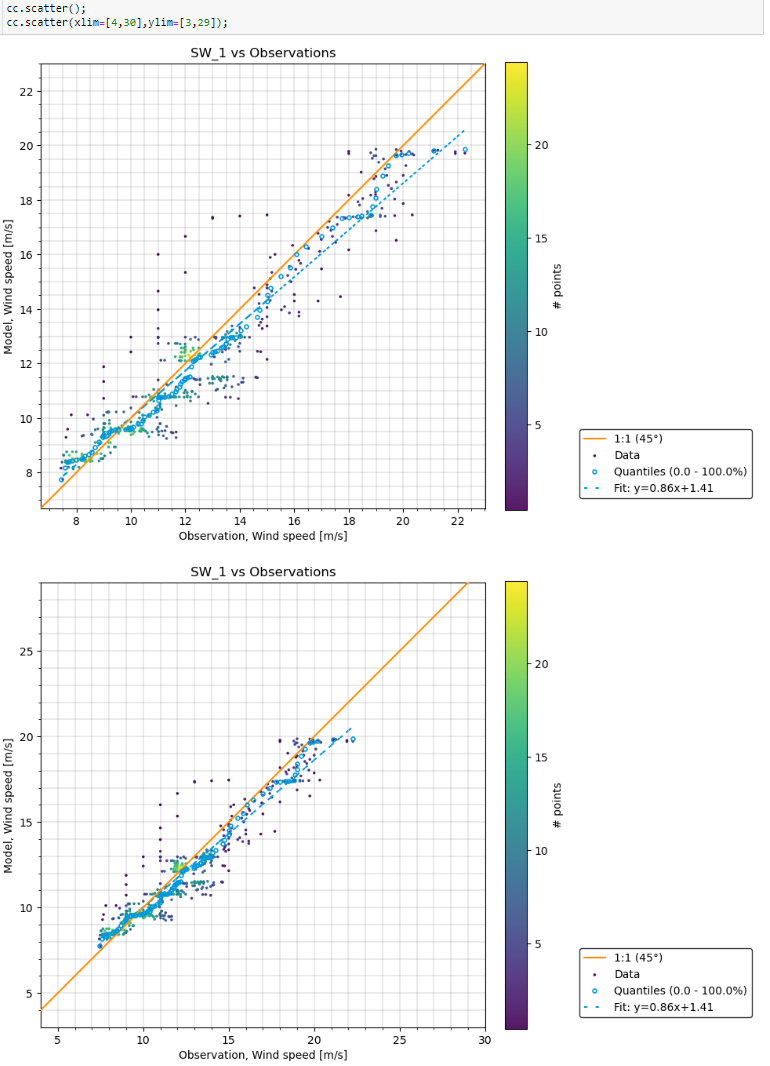
This implementation overrides user supplied xlim, which is not adhering to the principle of least surprise.

Isn't it possible to expand the axis limits only when defaults are being used?

@jsmariegaard
Copy link
Copy Markdown
Member

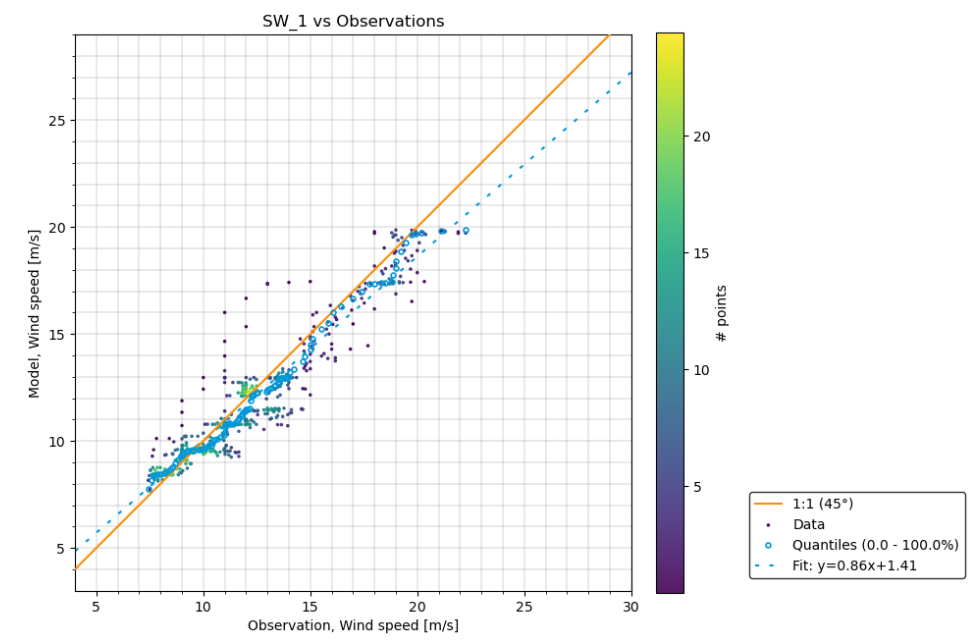
Thanks, @daniel-caichac-DHI for taking the time to fix this. I agree with @ecomodeller that user-provided arguments should not be overridden though. Also, I would prefer to have the regression line extended so it does not stop inside the plot area.

@daniel-caichac-DHI
Copy link
Copy Markdown
Collaborator Author

Ok so, to break it down:

  • the missing points fix will remain, as that was a bug
  • the expansion of axis limits must be implemented only when defaults are being used (ie, new defaults should be slightly larger than the exact data as of now). Also the regression line. I will see what I can do.

@daniel-caichac-DHI
Copy link
Copy Markdown
Collaborator Author

ok so

  • new default, an extra bin is added
  • if manually set, then manually set
  • do you still want to extend the regression line as is done with the 1:1 line?? this is not currently implemented when manually setting xlim, ylim (but I can do it). @jsmariegaard ? See how it looks now
    image

@jsmariegaard
Copy link
Copy Markdown
Member

Looks good. I think it would be great if you would extend the regression line @daniel-caichac-DHI , thanks

@daniel-caichac-DHI
Copy link
Copy Markdown
Collaborator Author

daniel-caichac-DHI commented Apr 19, 2023

Ok so I extendend the trend line so now it covers the whole plot always (ie, without setting xlim/ylim, as before, but also when xlim/ylim is manually set).
Ready to be merged :)

image

@jsmariegaard jsmariegaard self-requested a review April 19, 2023 10:38
Copy link
Copy Markdown
Member

@jsmariegaard jsmariegaard left a comment

Choose a reason for hiding this comment

The reason will be displayed to describe this comment to others. Learn more.

Great work

@daniel-caichac-DHI daniel-caichac-DHI merged commit 5cd94bf into main Apr 19, 2023
@jsmariegaard jsmariegaard deleted the style_limits_QQ branch November 20, 2023 12:39
Sign up for free to join this conversation on GitHub. Already have an account? Sign in to comment

Labels

None yet

Projects

None yet

Development

Successfully merging this pull request may close these issues.

3 participants