This is tested in a remote IJulia (100M LAN network), similar results can be observed from local Juno and IJulia. (this situation doesn't show in terminal REPL)
using TestImages
img = testimage("cameraman")
@time display(img)
@time display(img)
# 5.357775 seconds (9.10 M allocations: 544.977 MiB, 4.70% gc time)
# 2.960242 seconds (3.68 M allocations: 290.248 MiB, 11.38% gc time)
using TestImages, ImageShow
img = testimage("cameraman")
@time display(img)
@time display(img)
# 3.167470 seconds (8.06 M allocations: 404.792 MiB, 6.76% gc time)
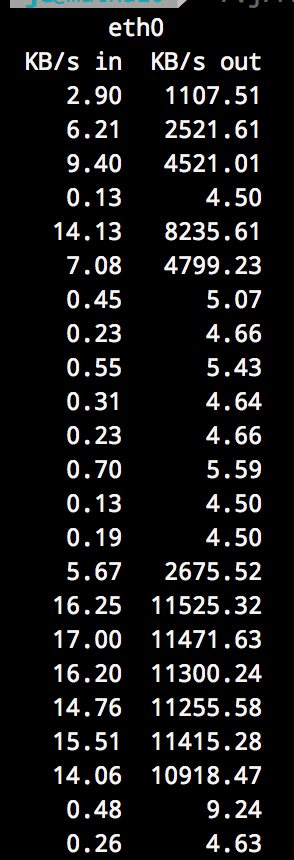
# 0.128455 seconds (9.60 k allocations: 1.644 MiB)Also, there's a significant network traffic if not using ImageShow (if using ImageShow the out traffic is at most 350Kb)
as a comparision,
# terminal REPL
using TestImages
img = testimage("cameraman")
@time display(img)
@time display(img)
# 0.616769 seconds (1.77 M allocations: 86.887 MiB, 3.71% gc time)
# 0.031414 seconds (72.89 k allocations: 2.940 MiB)
Any ideas what might cause this problem?
This is tested in a remote IJulia (100M LAN network), similar results can be observed from local Juno and IJulia. (this situation doesn't show in terminal REPL)
Also, there's a significant network traffic if not using
ImageShow(if usingImageShowthe out traffic is at most 350Kb)as a comparision,
Any ideas what might cause this problem?