I'm getting strange ε output from a Prism, where the vertices are generated by vectorizing a bitmap by marching squares (see skimage.measure.find_contours). Here's a small example:
import meep as mp
import numpy as np
import matplotlib.pyplot as plt
from skimage import measure

cell = mp.Vector3(3,3,0)

# The size of the array representing the level set.
# Larger L give a higher fidelity circle with more and smaller edges.
L = 75

xs = np.linspace(-1,1,L)
ys = np.linspace(-1,1,L)
X, Y = np.meshgrid(xs,ys)
design = X**2 + Y**2 < 1.0**2

# Extract contour and transform to design space.
contours = measure.find_contours(design, level=0.5)
contour = contours[0]  # we know there's only one contour.
contour = contour[:-1,:]  # exclude last point == first point.
contour /= L
contour -= .5
contour *= 2*R
vertices = [mp.Vector3(
    x=p[0], y=p[1], z=0.0
) for p in contour]

geometry = [mp.Prism(vertices, height=1, material=mp.Medium(epsilon=10))]
resolution = 25
sim = mp.Simulation(cell_size=cell,
                    geometry=geometry,
                    resolution=resolution)

fig, ax = plt.subplots(figsize=(10,10))
mp.quiet(True) # otherwise it outputs all prism vertices.
sim.plot2D(ax=ax, eps_parameters={'interpolation': 'none', 'cmap': 'Greys'})
mp.quiet(False)

for go in sim.geometry:
  if isinstance(go, mp.Prism):
    xs = [v.x+0.5/resolution for v in go.vertices] # the translation corrects for the fact that imshow plots pixel values half pixel
    ys = [v.y+0.5/resolution for v in go.vertices] # offset compared to skimage.measure.find_contour.
    ax.plot(xs, ys,'.-')
Which outputs the following figure (blue curve is vertices, raster is epsilon data):
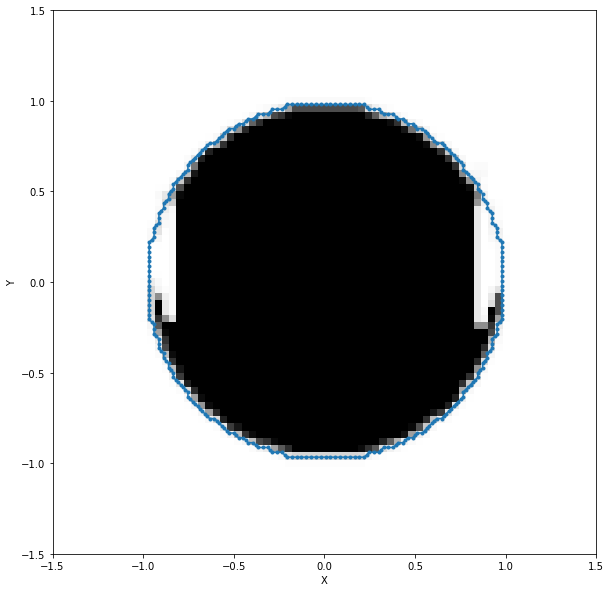
Without knowing more, I suspect there is some edge case (no pun intended) issue here, because all edges that come out of marching cubes are horizontal, vertical or exactly 45 degrees.
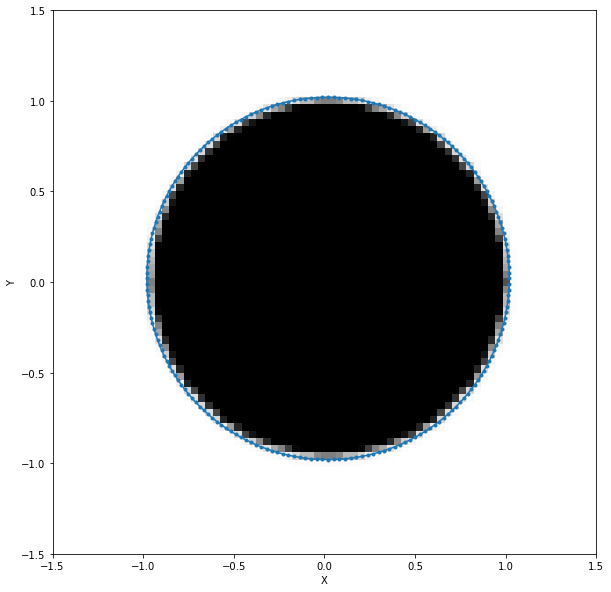
Indeed, I can do the same experiment where I generate the vertices on a "perfect circle":
# Manually make a well behaved circle polygon vertices.
cell = mp.Vector3(3,3,0)
N = 200
R = 1.0
phis = np.linspace(0,2*np.pi,N+1)
vertices = []
for phi in phis[:-1]:
  vertices.append(
      mp.Vector3(
        x=R*np.cos(phi),
        y=R*np.sin(phi),
        z=0.0,
      ))
geometry = [mp.Prism(vertices, height=1, material=mp.Medium(epsilon=10))]
resolution = 25
sim = mp.Simulation(cell_size=cell,
                    geometry=geometry,
                    resolution=resolution)

fig, ax = plt.subplots(figsize=(10,10))
mp.quiet(True)
sim.plot2D(ax=ax, eps_parameters={'interpolation': 'none', 'cmap': 'Greys'})
mp.quiet(False)
for go in sim.geometry:
  if isinstance(go, mp.Prism):
    xs = [v.x+0.5/resolution for v in go.vertices] # the translation corrects for the fact that imshow plots pixel values half pixel
    ys = [v.y+0.5/resolution for v in go.vertices] # offset compared to skimage.measure.find_contour.
    ax.plot(xs, ys,'.-')
Which results in the following, seemingly correct, output:
I'm getting strange ε output from a Prism, where the vertices are generated by vectorizing a bitmap by marching squares (see skimage.measure.find_contours). Here's a small example:
Which outputs the following figure (blue curve is vertices, raster is epsilon data):

Without knowing more, I suspect there is some edge case (no pun intended) issue here, because all edges that come out of marching cubes are horizontal, vertical or exactly 45 degrees.
Indeed, I can do the same experiment where I generate the vertices on a "perfect circle":
Which results in the following, seemingly correct, output:
