Nothing really urgent, but may be useful.
Eg.
cumulative_median <- function(y) {
  n <- length(y)
  out <- sapply(seq_len(n), function(x) median(y[seq_len(x)]))
  return(out)
}

cumulative_HPD <- function(y) {
  n <- length(y)
  out <- sapply(seq_len(n)[-1], function(x) coda::HPDinterval(coda::mcmc(y[seq_len(x)])))
  return(out)
}

cumulative_plot <- function(chain) {

  Median <- cumulative_median(chain)
  HPD <- cumulative_HPD(chain)
  plot(Median, type = "l", ylim = range(HPD))
  lines(HPD[1,], col = "red")
  lines(HPD[2,], col = "red")
  abline(h = median(chain), col = "blue")
}
chain <- rnorm(1000)
cumulative_plot(chain)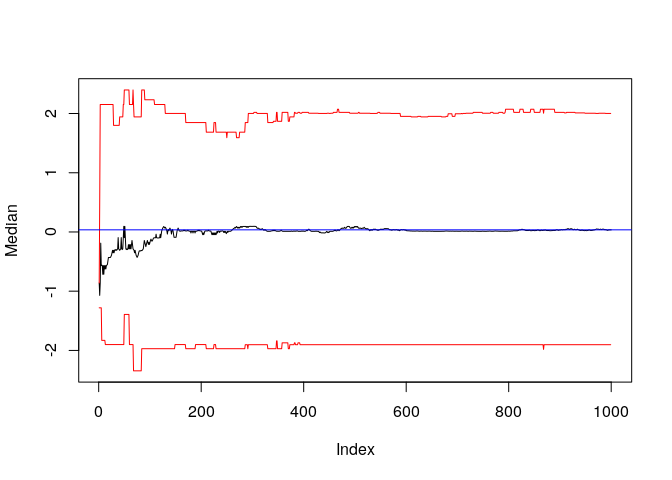
Nothing really urgent, but may be useful.
Eg.