Tailor is an application for data analysis and curve fitting. You can fit custom models to your data, simply by entering the mathematical expression and choosing suitable initial values. The application is tailored to giving you an intuitive interface for entering or inspecting your data, calculating additional quantities and comparing different model curves to give you a best fit. Fashion and math do have a bit of shared vocabulary. Hence the name, Tailor. Also, at both the Vrije Universiteit Amsterdam and the University of Amsterdam we use the book "An Introduction to Error Analysis" by John R. Taylor in our inquiry-based physics labs for students. Taylor discusses least-squares fitting in chapter 8.
The latest version is always available on the Releases page (link is also in the right sidebar on GitHub). Please scroll down to Assets and download the .msi-installer for Windows and the .dmg-installer for macOS. If you have uv installed, you can run Tailor without installing using:
uvx -p 3.12 tailorThe installers do give you a better integration with your OS, including file associations for Tailor projects. This means you can double-click on a Tailor project in the Finder on macOS or Explorer on Windows and Tailor will automatically open your project.
Workshop materials for Tailor are available from various conferences:
- NVON 2025 — Workshop op NVON 2025 congres: https://davidfokkema.github.io/NVON2025-workshop/
- GIREP-EPEC 2025 — Workshop on Tailor for the GIREP-EPEC 2025 conference in Leiden: https://davidfokkema.github.io/GIREP-EPEC-25-workshop/
- LNPD 2024 — Workshop at the Dutch National Physics Practicum Day 2024: https://davidfokkema.github.io/LNPD2024-workshop/
- Woudschoten 2023 — Nederlandstalig oefenmateriaal van onze workshop op Woudschoten 2023: https://davidfokkema.github.io/WND2023-workshop/
- Beyond the First Year 4 (2023) — Workshop on Tailor for the BFY4 conference: https://davidfokkema.github.io/BFY4-workshop/
We don't have a formal helpdesk, but please drop a line to d.b.r.a.fokkema@vu.nl if you need assistance or have questions.
- Spreadsheet-like editing of data
- Add multiple datasets in seperate tabs to a single project
- Import and export of CSV files
- Copy and paste data to and from external applications
- Add / remove columns or rows
- Drag to reorder columns
- Add columns based on mathematical expressions
- Create scatter plots with X/Y error bars
- Fit custom models to data based on mathematical expressions
- Create as many plots as you like to analyse multiple datasets or the same dataset with different models
- Use a wide range of Python operators and mathematical functions
- Deduce parameters automatically from the model expression
- Easily change initial values and update the initial fit in the plot window
- Apply bounds on parameters and fix a parameter to a particular value
- Restrict fits to a subset of the data by specifying a fit domain
- Include reduced chi-square statistic and parameter value and error estimations in the fit results
- Easily adjust axis labels and ranges
- Zoom and pan of all plots
- Export plots as PNG (bitmap) or PDF (vector) images
- Copy a dataset with associated plots and load new data to quickly repeat your analysis on a new measurement inside a single project
- Display multiple datasets and best fits in a single plot for easy comparison
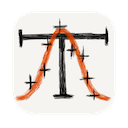
Screenshot showing the main window with the spreadsheet-like user interface for entering and viewing data:
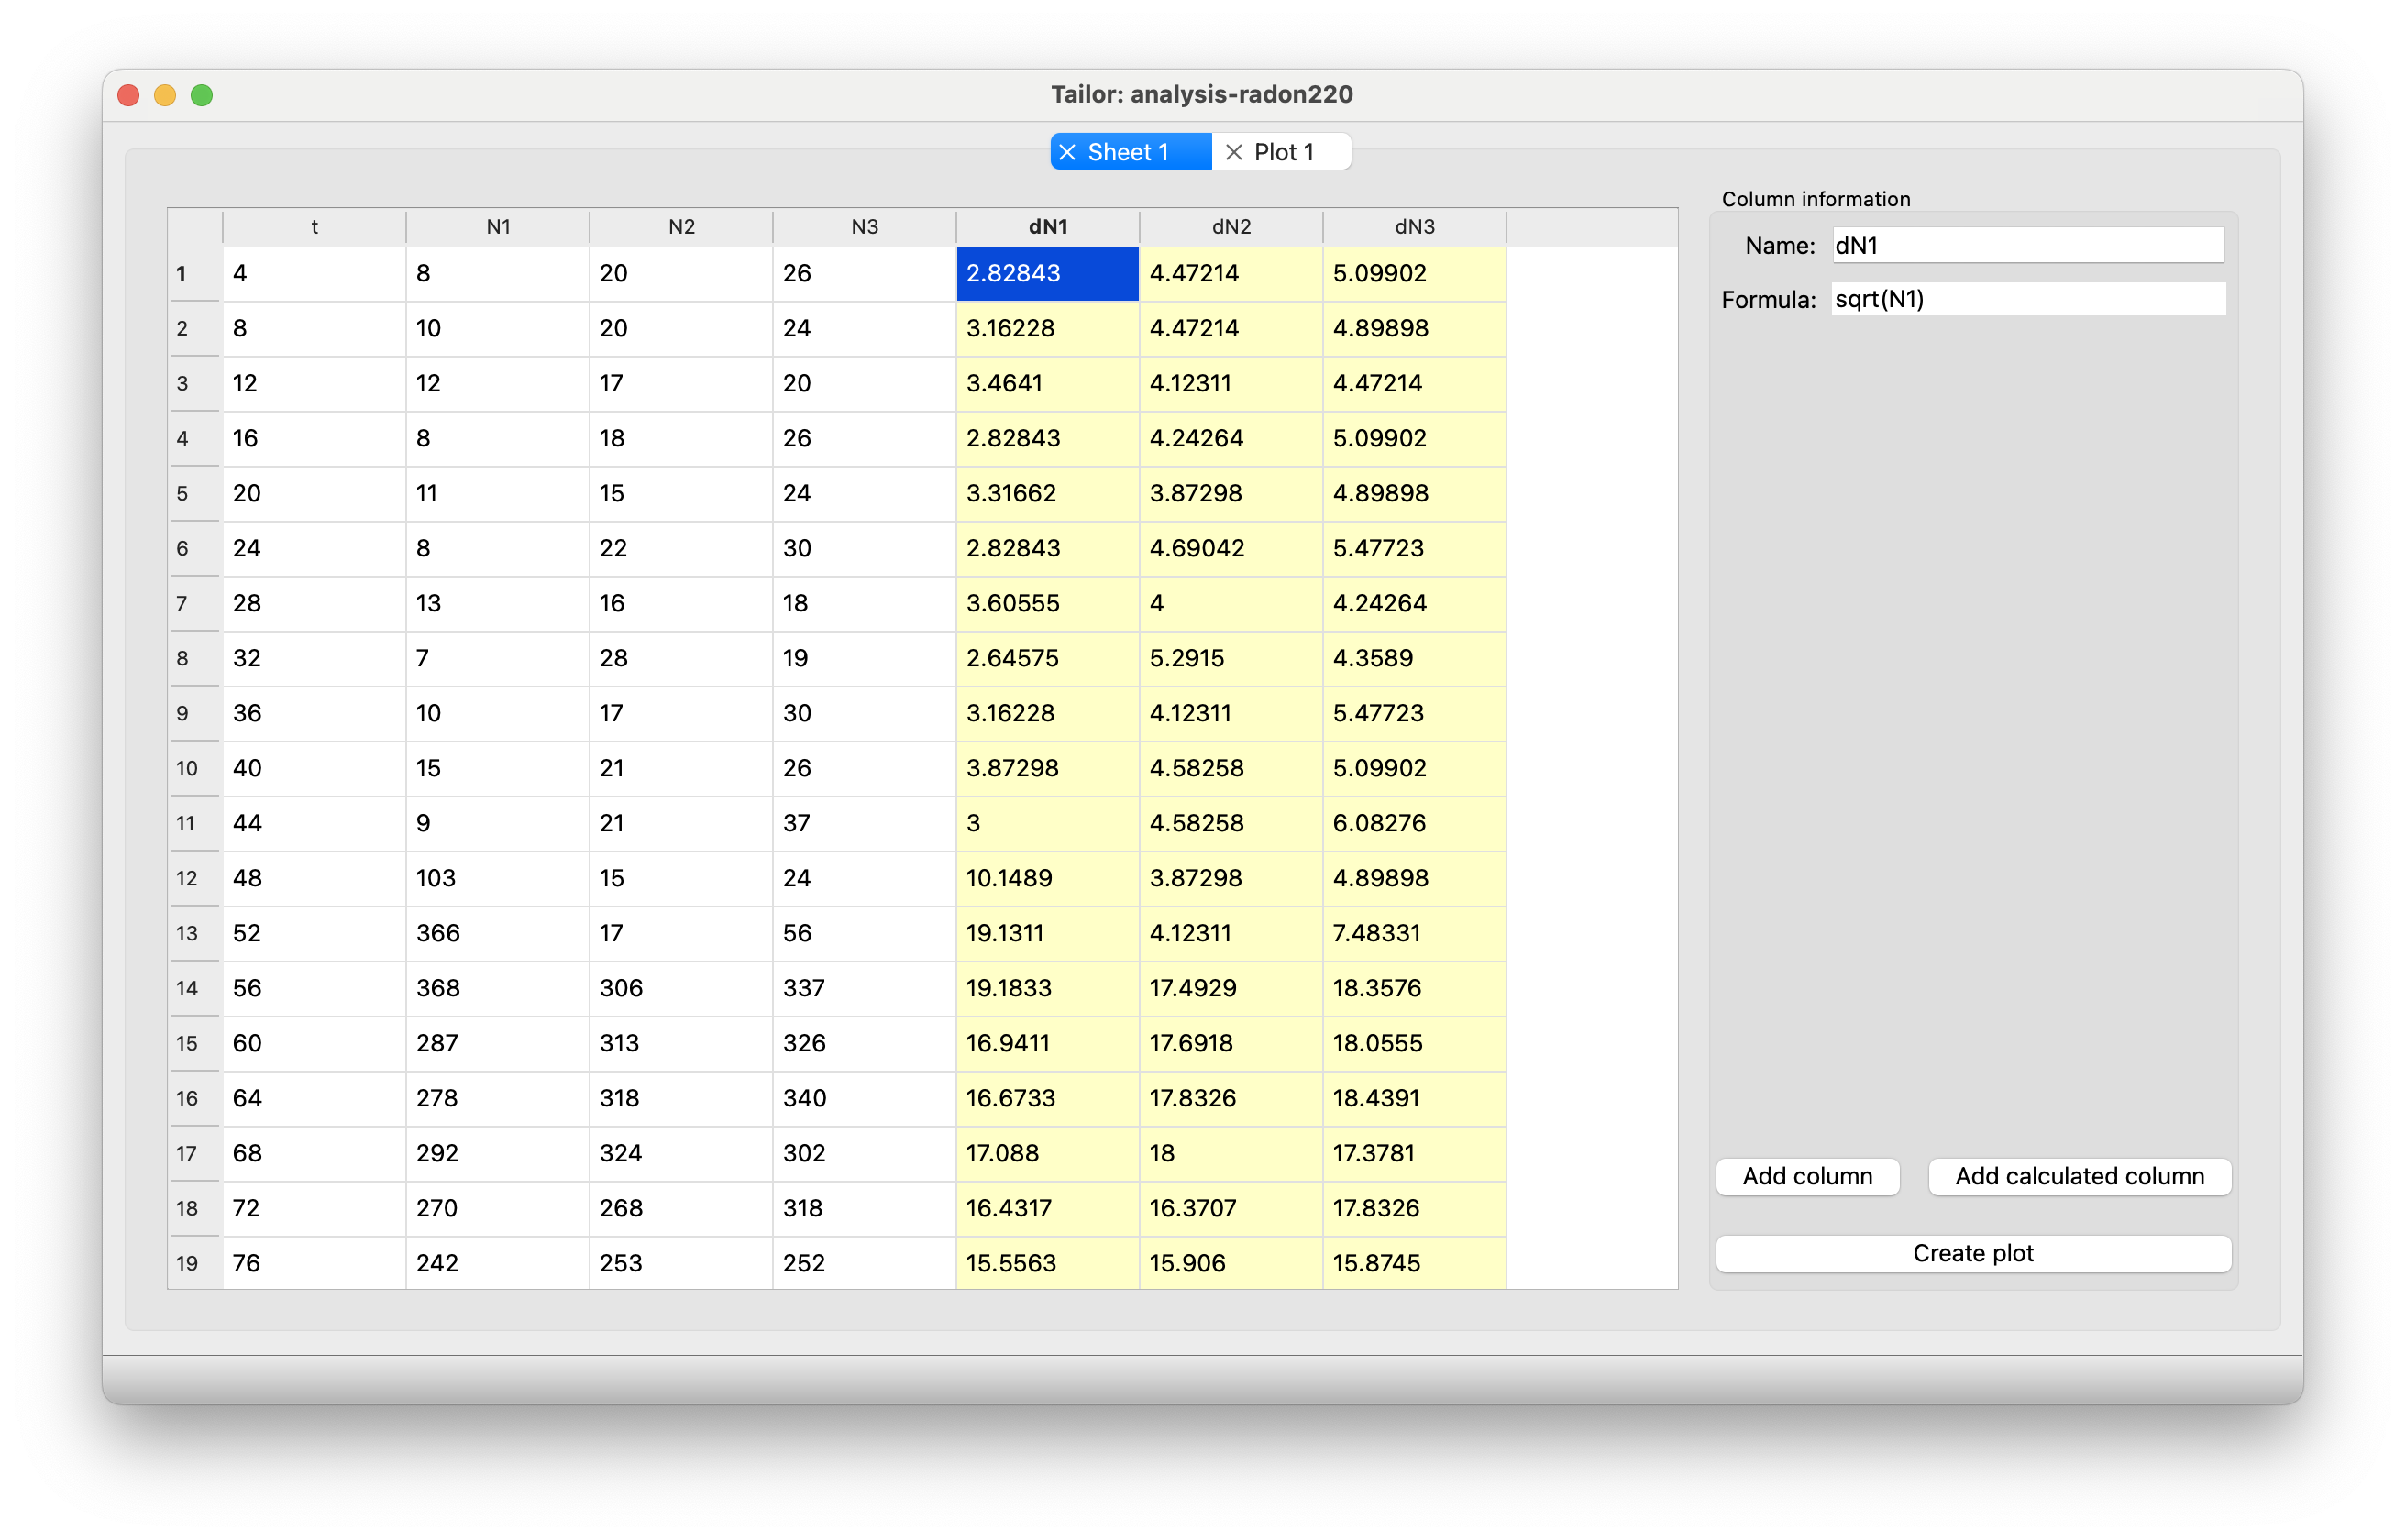
Screenshot showing the user interface for a diagram. In this screen you can zoom and pan the plot and enter a model expression to fit to the data. In this screenshot, an exponential decay model is fitted to data of the decay of a sample of the radon-220 isotope:
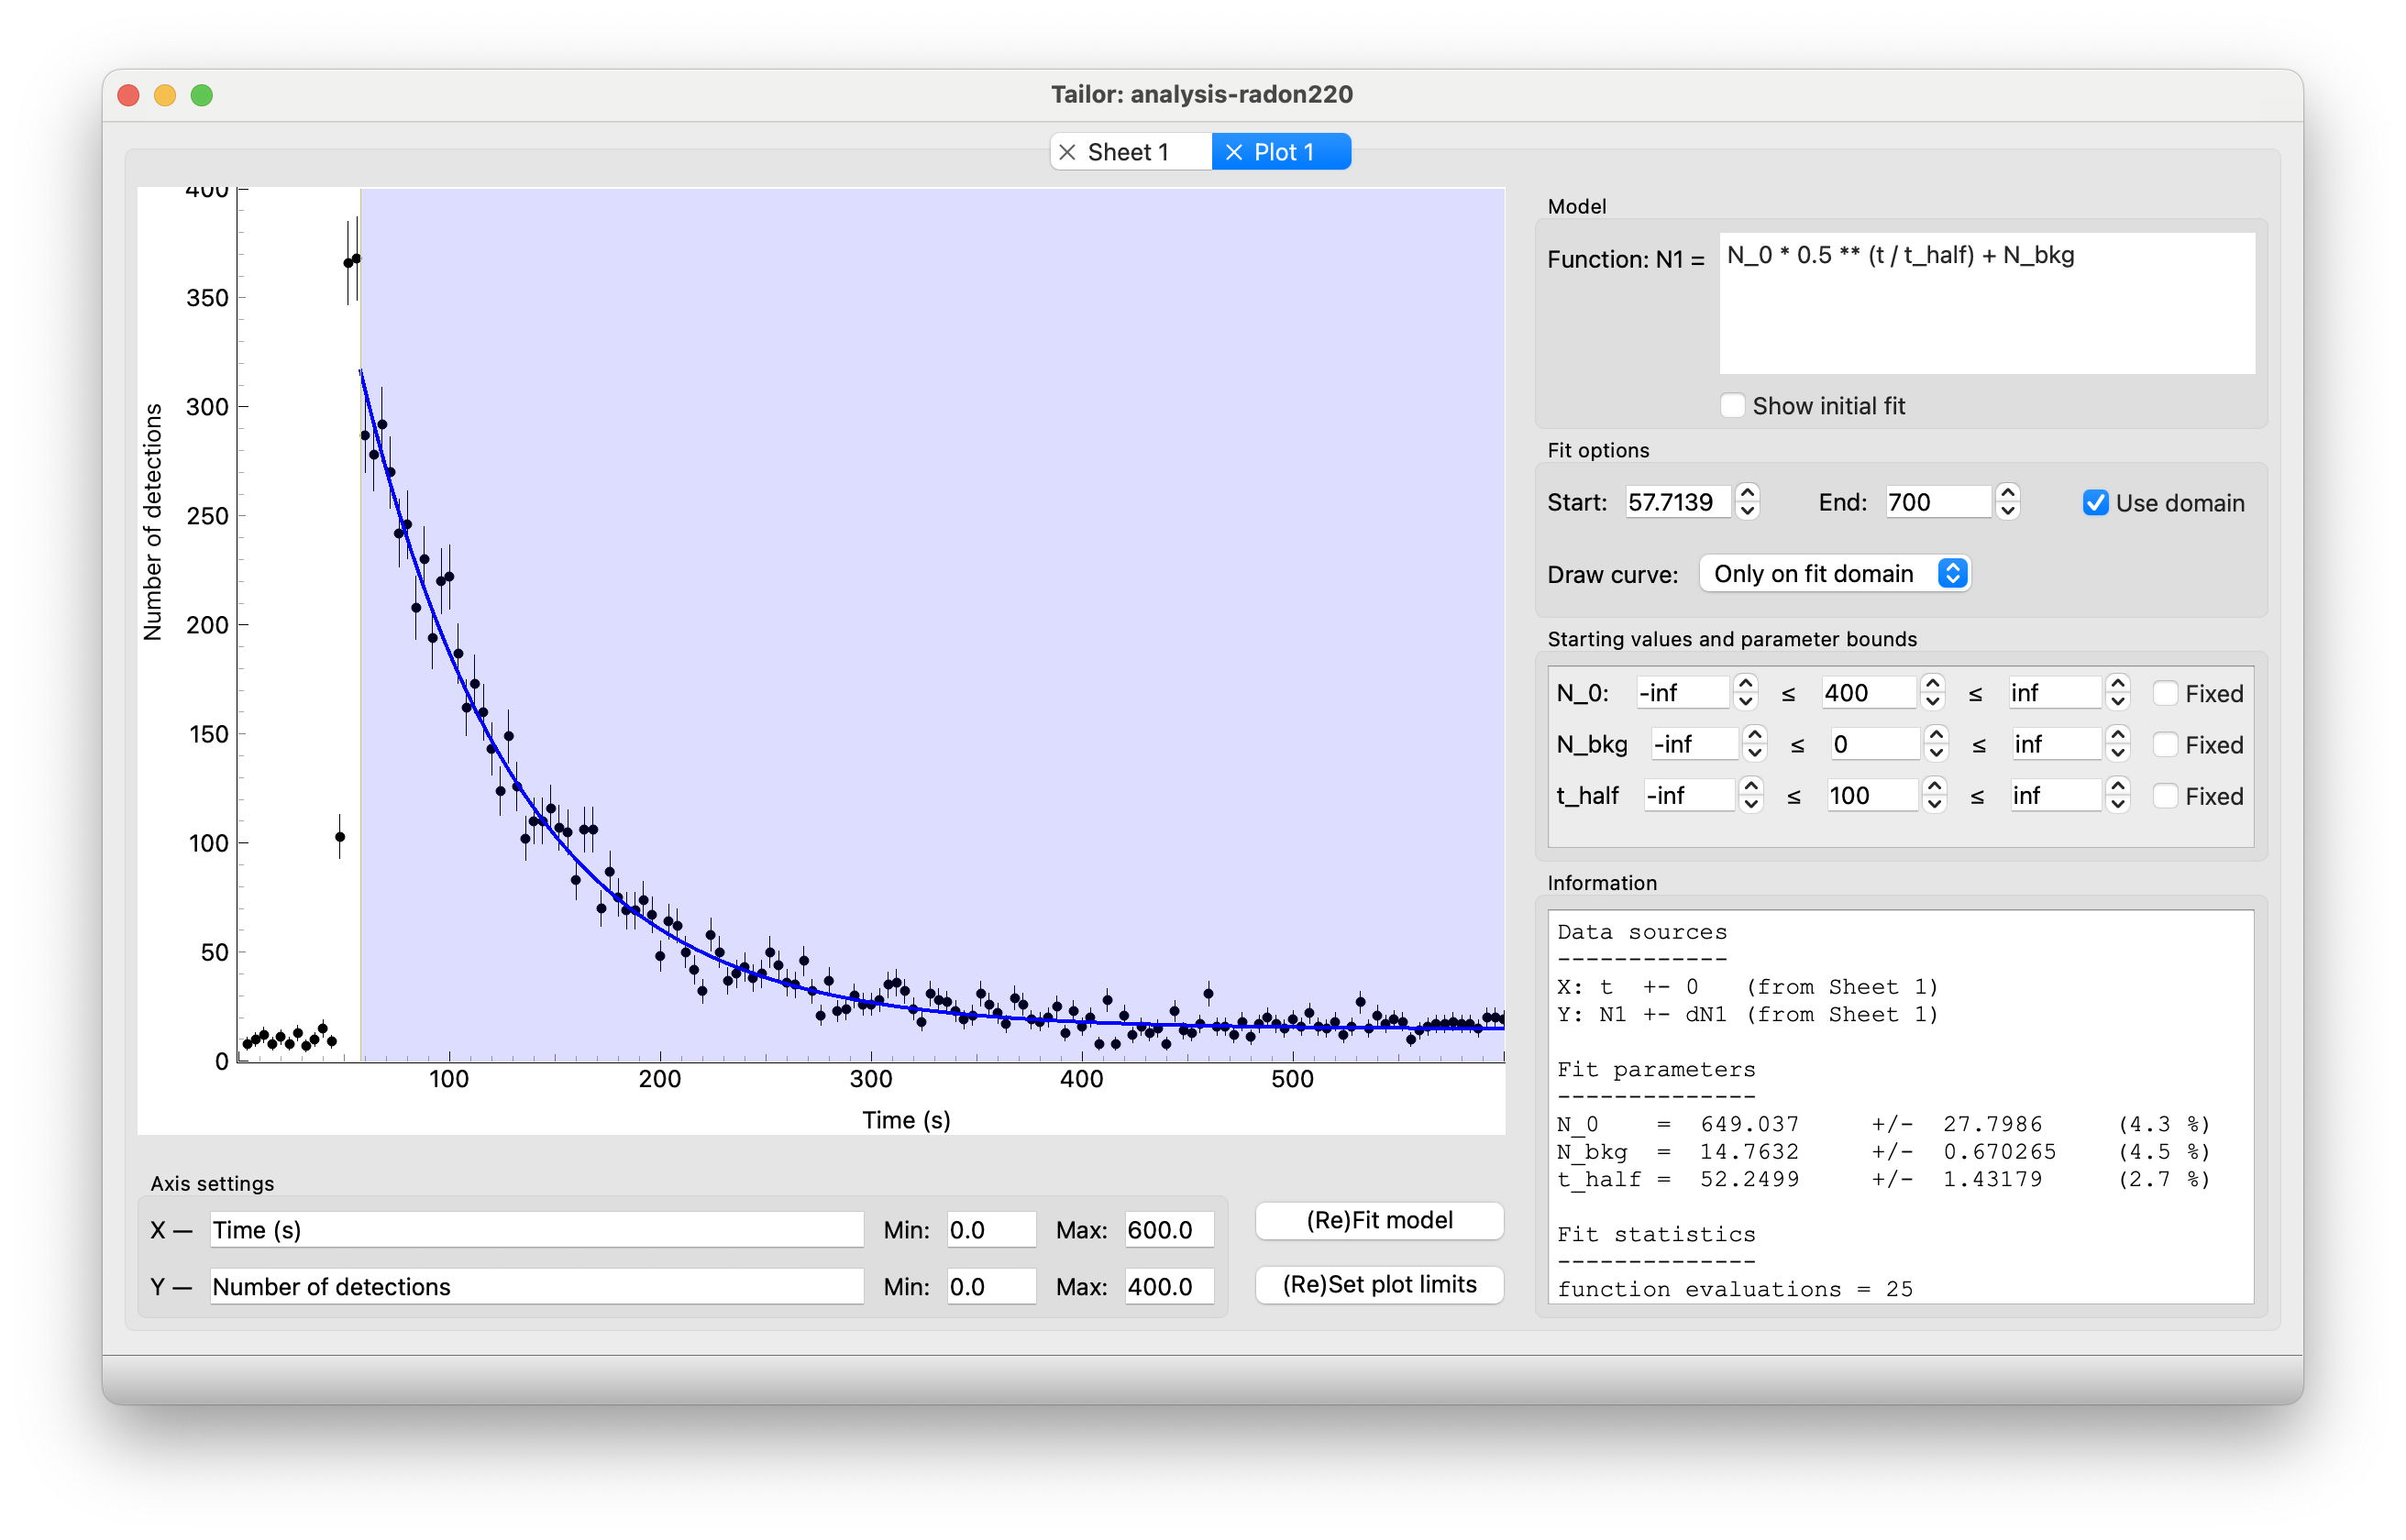
An example of an exported graph of the same dataset and fit as in the previous screenshot:
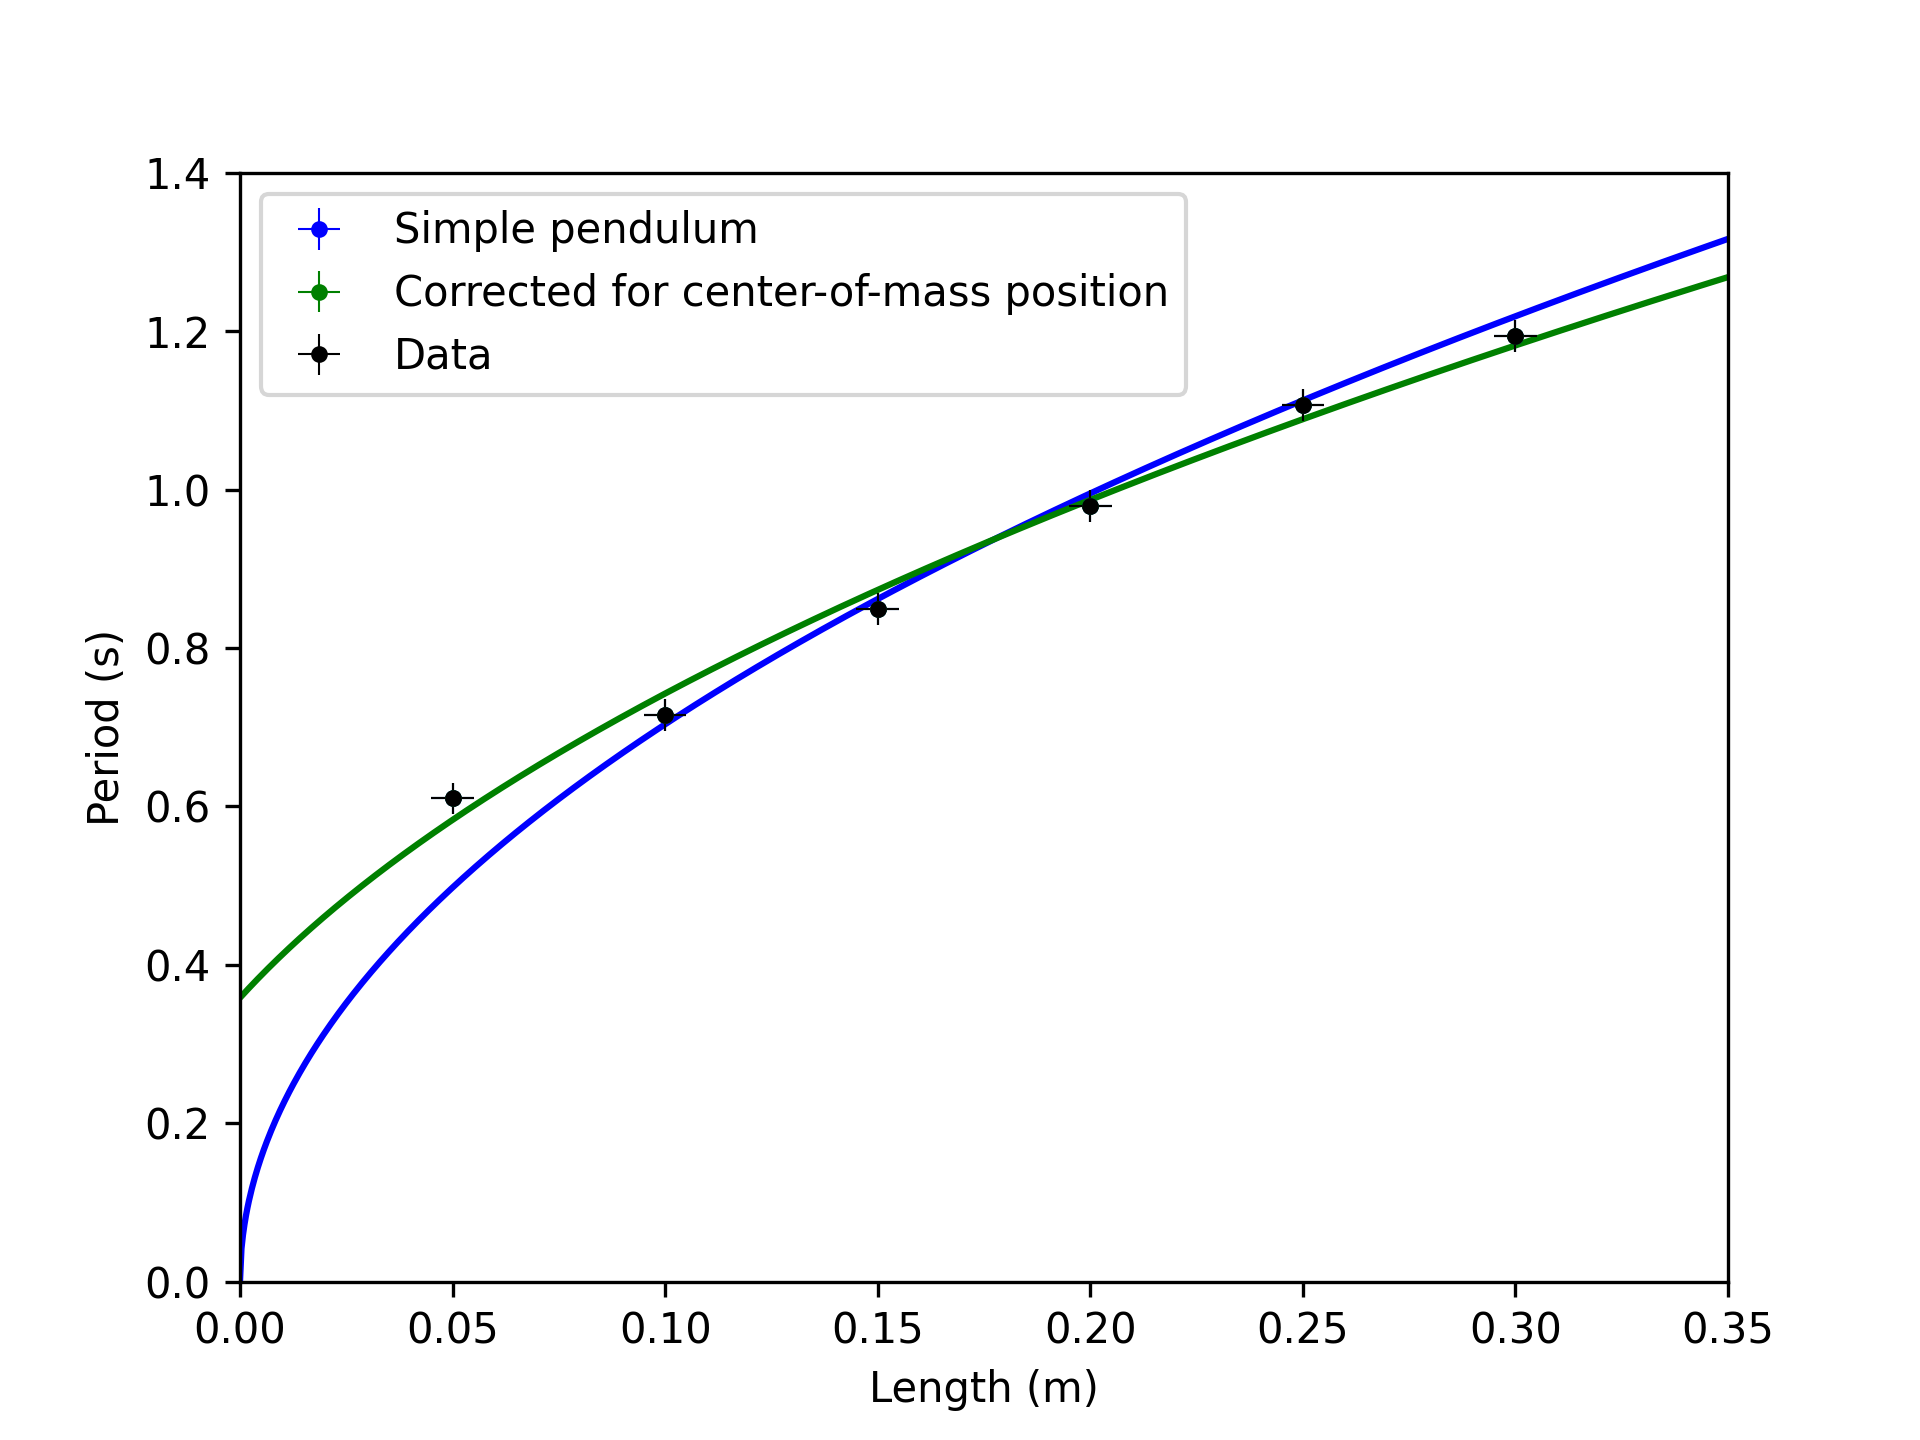
Tailor can display multiple datasets and best fits in a single plot:
This cross-platform app was generated by Briefcase - part of The BeeWare Project. If you want to see more tools like Briefcase, please consider becoming a financial member of BeeWare.