Kibana version: master
Elasticsearch version: master
Server OS version: Mac OS X
Browser version: Chrome latest
Browser OS version: Mac OS X
Original install method (e.g. download page, yum, from source, etc.): From source
Describe the bug:
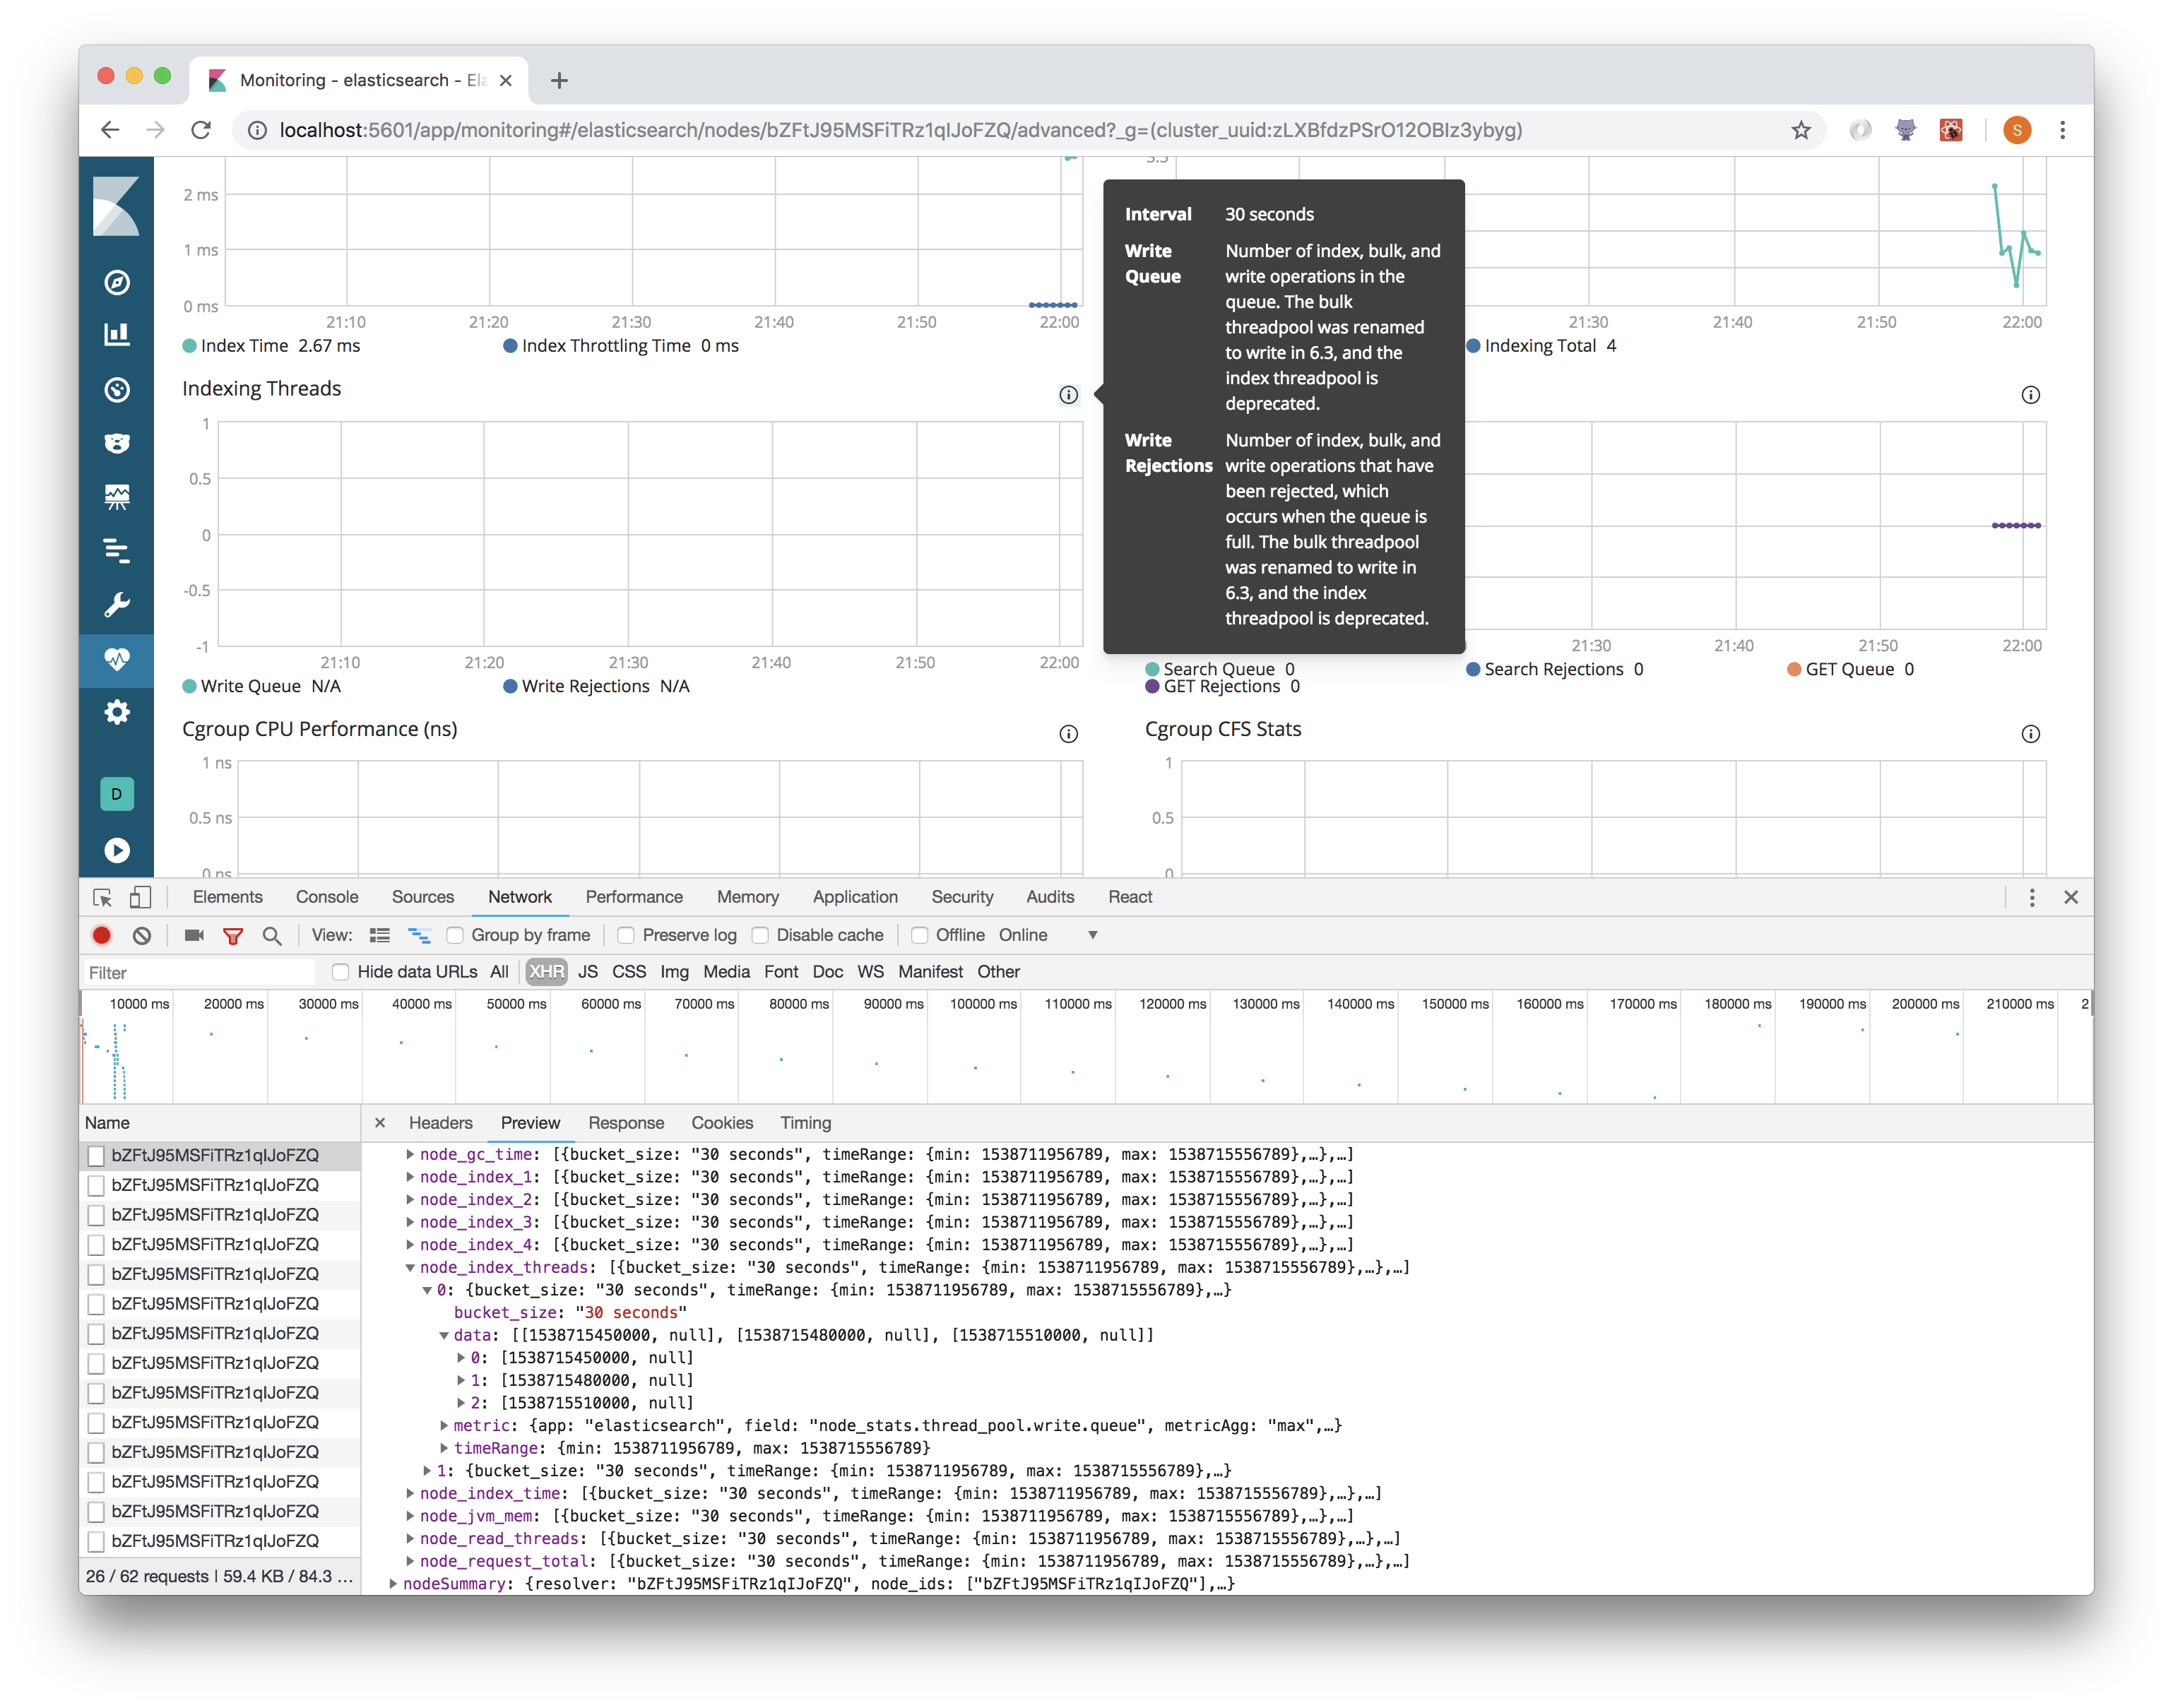
See Indexing Threads chart and corresponding node_index_threads field in response JSON in screenshot below:
Steps to reproduce:
- Turn on monitoring
- Visit the Elasticsearch Node Listing page
- Click on a node
- Visit the Advanced tab for the node
Expected behavior:
I would expect the chart to show some values, even if they are 0s. Similarly the chart's legend should some values other than N/A.
Kibana version: master
Elasticsearch version: master
Server OS version: Mac OS X
Browser version: Chrome latest
Browser OS version: Mac OS X
Original install method (e.g. download page, yum, from source, etc.): From source
Describe the bug:
See Indexing Threads chart and corresponding
node_index_threadsfield in response JSON in screenshot below:Steps to reproduce:
Expected behavior:
I would expect the chart to show some values, even if they are 0s. Similarly the chart's legend should some values other than N/A.