Visualization
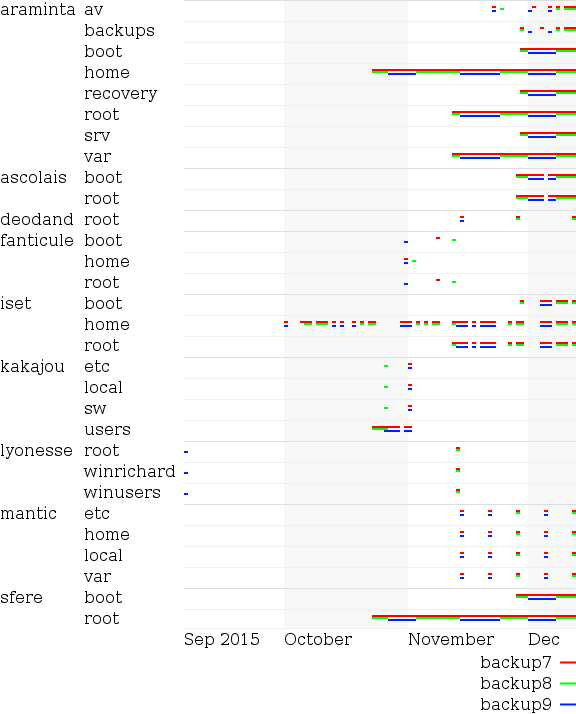
I have been working on a new rsbackup feature to provide graphical representation of backup history. It was release as part of 4.0.
If you want to try it out, check out master and build it in the normal way, then try out the new rsbackup-graph command. You will need, at least:
apt-get install libpangomm-1.4-dev libcairomm-1.0-dev
There is now an rsbackup-graph man page (though most of the new documentation is in rsbackup(5)).
I welcome feedback, using sgo-software-discuss.
The rest of this page is now historical information.
This is now basically done!
There's a lot of functionality yet to do:
Automatic selection of colors (underway)User configuration of colorsUser configuration of padding and dimensionsUser configuration of fontUser configuration of layout (e.g. hosts on the left, volumes on the right)Integrate the output into the HTML report, as an option
There's some technical work that might need to be done to. These may be considered, to some extent, open questions:
- Maybe refactor
Commandclass to support more than one executable. - Build librsbackup as a shared library, so the the code isn't all duplicated.
- This would be a 'private' shared library between
rsbackupandrsbackup-graph- not something with a published API (at least without strong demand). - Done experimentally, but not on master. I decided not to include this (it could be revisited if there are more separate executables).
- This would be a 'private' shared library between
-
Split into two.debfiles.rsbackup.debis be much as it is in 3.0,rsbackup-graph.debcontains the visualization tool(s).- The reason for the split is to avoid a backup program depending on a huge rendering stack for vector graphics and fonts.