This repository was archived by the owner on Jun 18, 2024. It is now read-only.
This repository was archived by the owner on Jun 18, 2024. It is now read-only.
How to set en exact minimum value for spectrum display mode? #132
Description
Hello, first of all, I believe you have filled some very major gap in grafana with your plug in. Kudos to that.
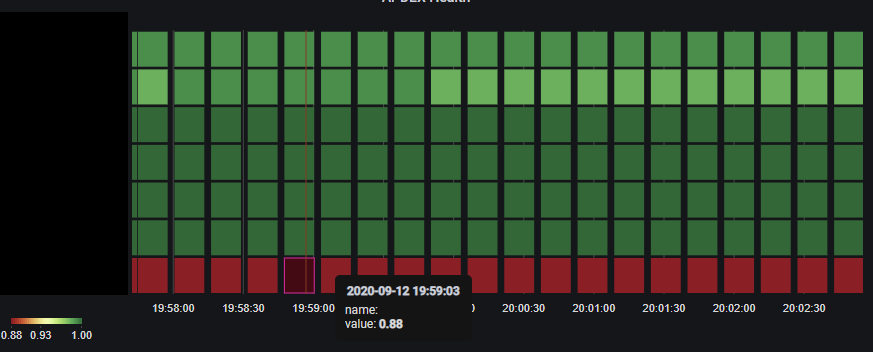
I am using statusmap in spectrum mode to view some continuous values of services between 0-1. In the spectrum mode, I want to see red for 0, and 1 for green and the gradient for everything in between. When everything is green (1) and some value changes to, say, 0.88, then the spectrum is fitted to 0.88-1 Lowest value becomes red, and the legend shows the colors of 0.88-1.0 range. Is there a way to tell the plugin to assume lowest value to be 0?
Note: I tried setting min and max values of color scale in color section.