This project processes data that was generated by the Java-Simulation.
The Simulation-Part simulates a a detached house with an off-grind photovoltaic system.
Every simulated Sensor has its own socket connection and sends its data via a JSON string.
The goal of this project was to get in touch with stream processing.
To achieve this goal we use the python library streamz.
Some of the incoming data get just displayed at the dashboard.
In these cases the processing part is simple:
- extract the important Data from the JSON
- make a validation check
- and as sink a updateDataOnDashboard - Function
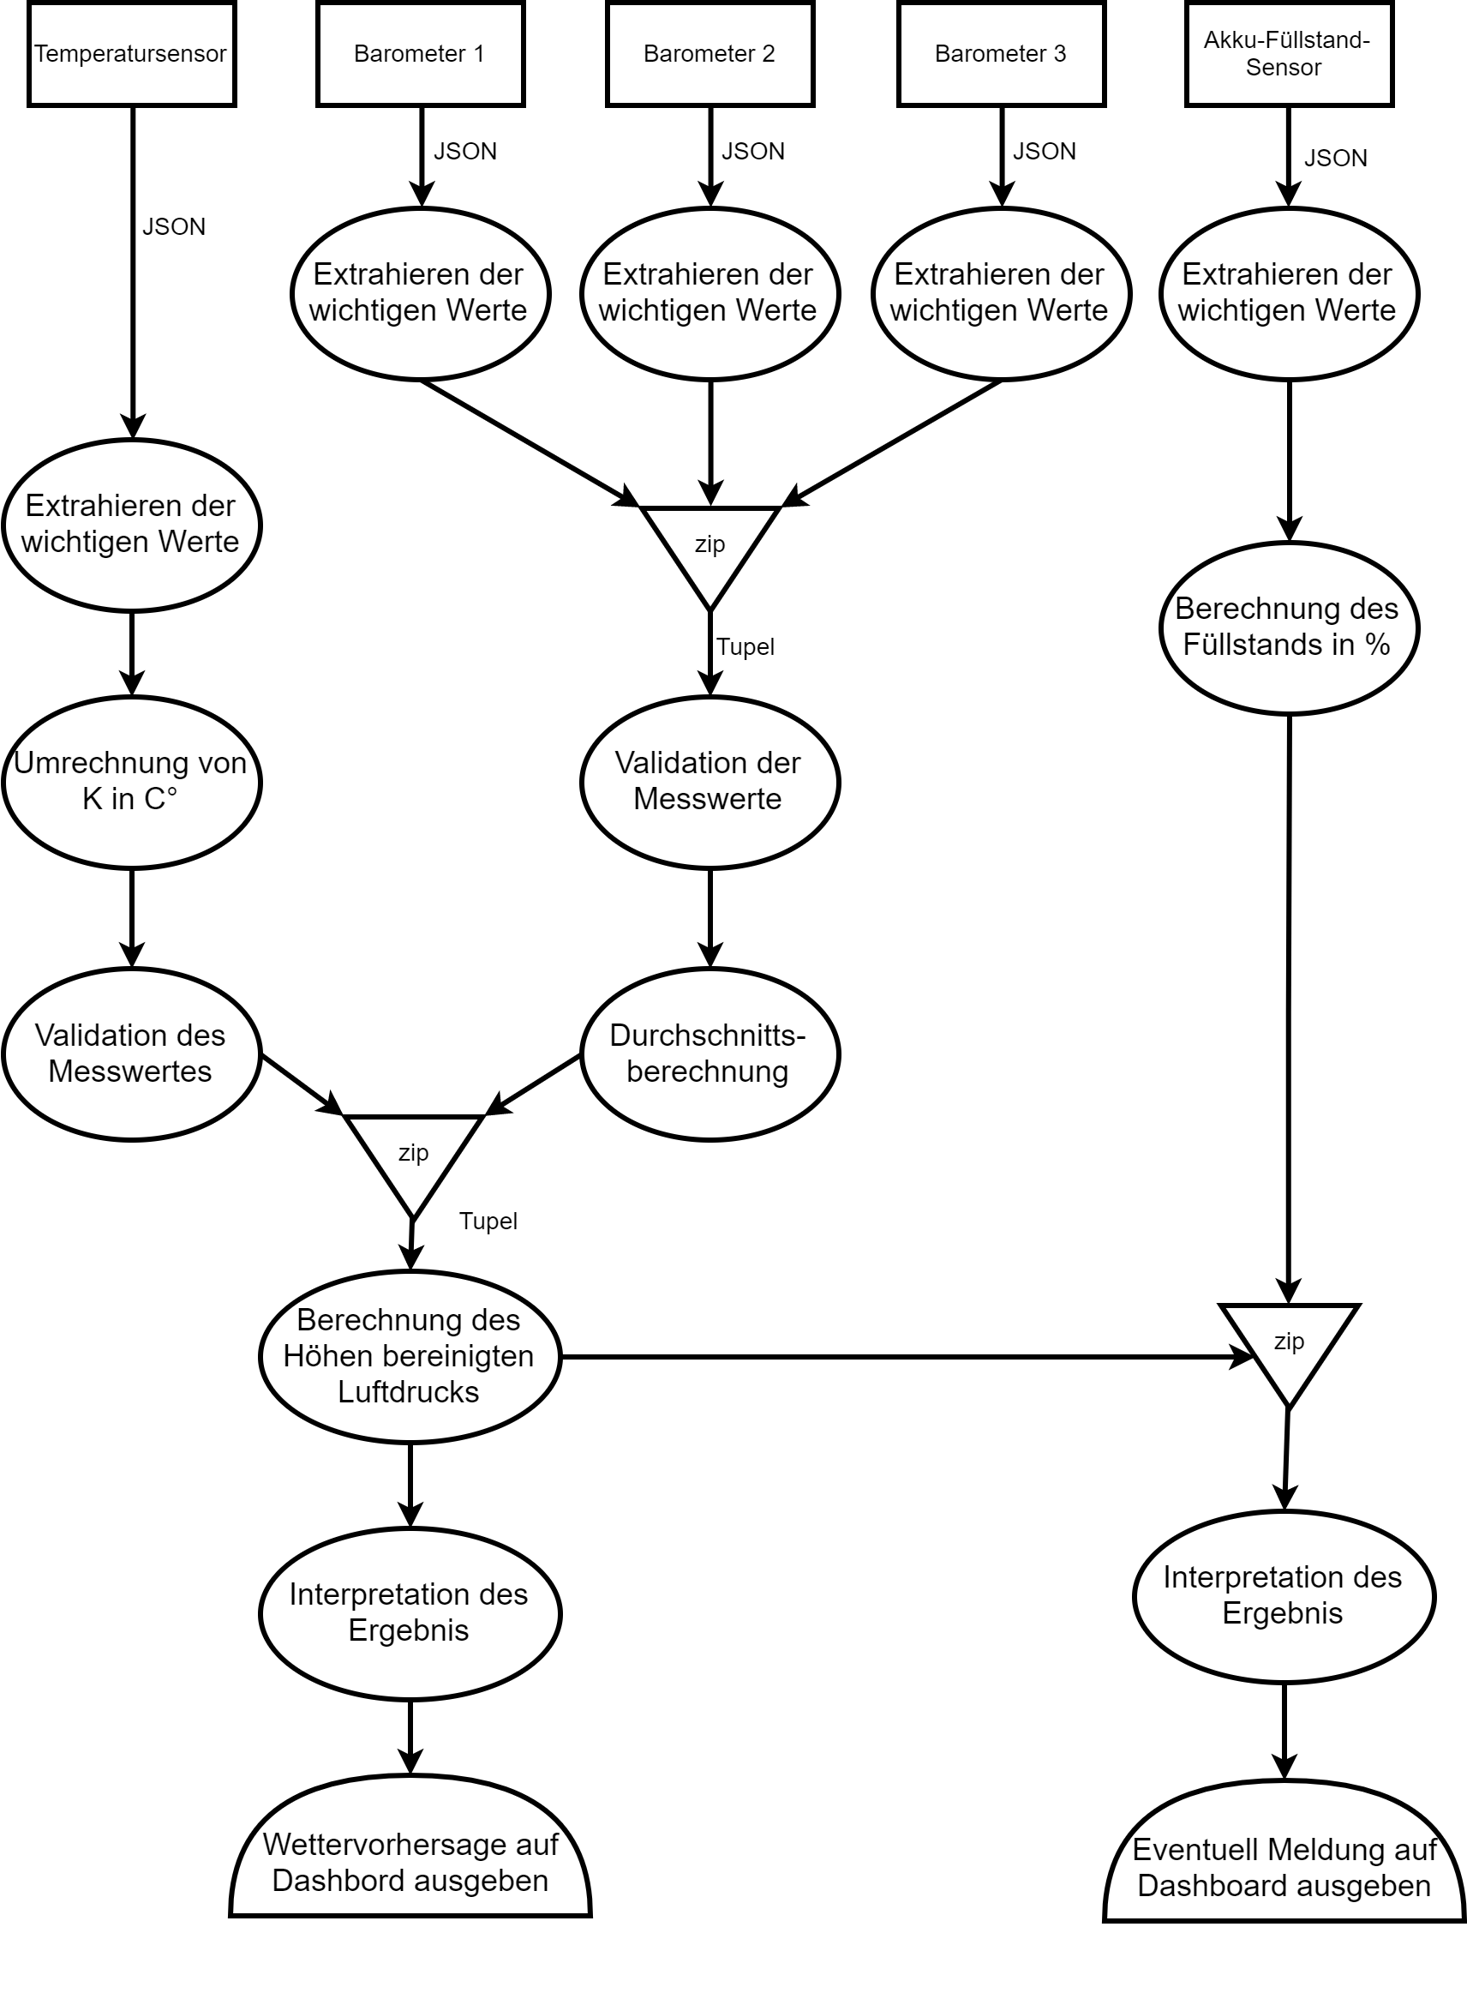
But some other output is more complex here is an example of the weather forecast calculation as flow chart:
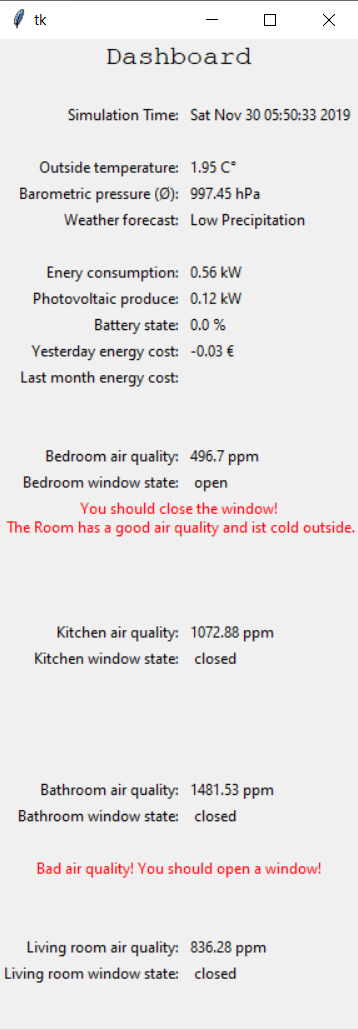
This project output the following Data:
-
Simulation Time
-
Outside temperature
-
The average of the 3 barometric pressure
-
weather forecast (calculated of the barometer and temperature values)
-
current energy consumption
-
current produced energy by the photovoltaic system
-
battery state in %
-
the yesterday energy cost
-
the energy cost of the last month
-
energy available warning (if the battery is full and the seems to getting worse)
-
For 4 rooms the following:
- Air quality (CO2 portion in ppm)
- window state
- open warning (if air quality is bad)
- close warning (if the air quality is good and it is cold outside)